
Web Scraping in Practice
Web scraping is a common tool in a Data Scientist’s toolkit. Sometimes, data needed for a project will come in a structured format, whether it be stored in a database or a flat-file. However, there are occasions where data isn’t stored or even collected yet. In the event that the data that you need for a project is available on a website, you can leverage web scraping as a means to collect the data you need. A simple way to think about web scraping is to consider it as a procedure through which you make a call to website and then select and wrangle the data you need in order to meet the needs of the project.
To demonstrate web scraping in practice, I will walk through a simple example and explain each step in the procedure. It is important to note that every project and every website will have unique challenges and flavors. This is a simple example, but it should give you the necessary tools to get started.
Indiana University Men’s Basketball is a storied program in college athletics. The program has won five National Championships in total, and the 1976 Championship team remains the last undefeated Champion as of the 2022-2023 season. This particular project focuses on the roster of IU Basketball teams throughout the years, relative to the home State of the athletes. The challenge is to answer the following question:
“How has the composition of home States of the IU Men’s Basketball team roster changed over time?”
Fortunately, Indiana University Athletics hosts a website that has the information that we need: historical roster information going back to 1953, names of the athletes, and their hometown. Now that the data has been located, web scraping can begin.
Import Libraries
The rest of this post will contain a mixture of python code as well as narrative text; the idea is to present first each block of code in plain terms to describe what is happening and why. The nature of this script is basically sequential, which will allow you to be methodical about working through each block step-by-step. If you are familiar with some concepts, feel free to skip ahead due to the sequential nature.
First, we must import the necessary libraries to do the tasks we need. Pandas is a common data science library used to handle, wrangle, and analyze structured data. We will use pandas to store the data we collect from the website in a tabular format. BeautifulSoup is a library that helps parse html files, which is a common web file format. Requests will allow you to make calls to websites to actually retrieve the html, and then matplotlib and seaborn are common data visualization libraries.
import pandas as pd
from bs4 import BeautifulSoup
import requests
import re
import matplotlib.pyplot as plt
import seaborn as sns
Create Roster Year List
After exploring IU Athletics website to find the roster data that we need, we know that the each roster year’s data is contained within a separate URL. For example, here is the URL for the 1953-54 season:
https://iuhoosiers.com/sports/mens-basketball/roster/1953-54
That structure requires that we have a way to call each URL in a loop. In order to do this, we will create a list of all the roster years in the format that we need. The list comprehension below does the trick to do this succinctly. Below, you can see the first five years printed out.
years = [str(year) + "-" + str(year+1)[2:] for year in range(1953, 2023)]

years[0:5]
['1953-54', '1954-55', '1955-56', '1956-57', '1957-58']
Define Web Scraping Function
Now that we have a data structure for the roster years, we will now move on to defining a function that will perform the request to the server and collect and wrangle the data we are looking for. This is the most challenging part of the process, because you can’t know how to locate the data you are looking for just by virtue of knowing the website. For this demonstration, we will use the “Inspect” tool in Google Chrome to figure out how to locate the data. Before moving on, I suggest you look over this article. It shows the exact process that we used in order to locate the html tags and attributes we need.
https://www.greengeeks.com/tutorials/use-the-inspect-element-tool-in-chrome/
To begin with the function, the first task is to use the get function from the requests library to retrieve the html file from the server. The function takes in the roster year as an input string so that we can build the proper URL. Once the html has been retrieved, we feed the html content to the BeautifulSoup html parser. Once BeautifulSoup has parsed the html, it allows you to access data in a user-friendly manner. With the new access BeautifulSoup provides, we can start working with the player names and hometowns from the website. There are many ways to do this; for this example, we chose to store them in two separate lists. To create the two lists, you will see two separate list comprehensions, one for player names and the other for hometowns. What happens here is that we are using the find_all method of the BeautifulSoup object and using the tag and attributes that we found from using the Inspect tool in Google Chrome to locate the right data. The find_all function returns a list of all the html elements that match your query. The list comprehension loops through that list, then selects and strips the text, and stores it inside the list.
def get_roster_data(year):

    page = requests.get('https://iuhoosiers.com/sports/mens-basketball/roster/' + year)

    soup = BeautifulSoup(page.content, "html.parser")

    player_names = [name.text.strip() for name in soup.find_all("div", attrs={'class': 's-person-details__personal-single-line s-text-paragraph-bold flex gap-2'})]
    player_hometowns = [town.text.strip() for town in soup.find_all("span", attrs={'class': 's-person-card__content__person__location-item'})]

    return player_names, player_hometowns
With our function defined, we can now use another list comprehension to loop through all of the roster years. The returned lists for each year can then be stored in another list, called roster_data here.
roster_data = [get_roster_data(year) for year in years]
Next, we perform a quick check of the data. What we are looking for is that list of players is the same length as the list of hometowns. Data coming from websites can be messy, so we are checking here to make sure that it matches our expectations. What you will notice in the roster_check list comprehension is that it is checking that double the players is equal to the number of hometowns. Below it, when we inspect a list of hometowns, you will see that there are two entries for hometowns. This is due to the nature of the website and the attribute we searched for being used twice. Fortunately, we can see that every second entry is what we are looking for, in that it has the City and State format.
roster_check = [len(players)*2 == len(towns) for players, towns in roster_data]
sum(roster_check) == len(roster_data)
True
roster_data[0][1]
['Collinsville',
 'Collinsville, IL',
 'Reitz',
 'Evansville, IN',
 'Manual',
 'Louisville, KY',
 'Marion',
 'Marion, IN',
 'Gerstmeyer',
 'Terre Haute, IN',
 'Fortville',
 'Fortville, IN',
 'Kokomo',
 'Kokomo, IN',
 'Fort Branch',
 'Fort Branch, IN',
 'Tell City',
 'Tell City, IN',
 'New Albany',
 'New Albany, IN',
 'Winslow',
 'Winslow, IN',
 'Northside',
 'Fort Wayne, IN',
 'New Albany',
 'New Albany, IN',
 'Wash.-Clay',
 'South Bend, IN',
 'Vocational',
 'Chicago, IL',
 'Wiley',
 'Terre Haute, IN',
 'Oak Park',
 'Oak Park, IL',
 'Kokomo',
 'Kokomo, IN',
 'Montclair',
 'Montclair, NJ',
 'New Albany',
 'New Albany, IN']
Now that we know this structure, we can do some simple clean-up. We will take advantage of list splicing to grab every second element of the hometown list, which you will see in the roster_data_clean list comprehension where we use towns[1::2] What this command means in English is “starting from the second element (Python is zero index-based, so 1 is actually the 2nd element), return every second element in the list.” We perform another check just like before and validate that we are getting what we need.
roster_data_clean = [(players, towns[1::2]) for players, towns in roster_data]
roster_clean_check = [len(players) == len(towns) for players, towns in roster_data_clean]
sum(roster_clean_check) == len(roster_data)
True
roster_data_clean[0][1]
['Collinsville, IL',
 'Evansville, IN',
 'Louisville, KY',
 'Marion, IN',
 'Terre Haute, IN',
 'Fortville, IN',
 'Kokomo, IN',
 'Fort Branch, IN',
 'Tell City, IN',
 'New Albany, IN',
 'Winslow, IN',
 'Fort Wayne, IN',
 'New Albany, IN',
 'South Bend, IN',
 'Chicago, IL',
 'Terre Haute, IN',
 'Oak Park, IL',
 'Kokomo, IN',
 'Montclair, NJ',
 'New Albany, IN']
Create DataFrames
The next step in our process is to create a function that processes the roster data and constructs a pandas DataFrame. Pandas is a library that allows Data Scientists to work effectively with structured, tabular data. Our simple function takes in the two lists for each roster year as well as the roster year itself and constructs a DataFrame from it. You can see that it creates three columns and returns the entire DataFrame as the output.
def create_dfs(year, roster_data):

    player_names, player_hometowns = roster_data

    iu_df = pd.DataFrame()

    iu_df["Name"] = player_names
    iu_df['Hometown'] = player_hometowns
    iu_df.insert(0, "Roster Year", year)

    return iu_df
This new function can then be used inside another list comprehension so that it is applied to each roster year. You will also notice how we used the zip function to include the roster year inside as it loops through.
roster_dfs = [create_dfs(year, roster_data) for year, roster_data in zip(years, roster_data_clean)]
Conveniently, pandas includes a concat function, which allows us to combine our list of DataFrames into one large DataFrame. This is perfect for what we have constructed to far. After calling concat, we have printed out the first five rows using the head method of our DataFrame so you can see what it looks like. Additionally, we have saved off our DataFrame to a csv so that we can load it up in the future without needing to scrape the web again.
iubb = pd.concat(roster_dfs)
iubb.to_csv("iubb_rosters.csv", index = False)
iubb.head()
| Roster Year | Name | Hometown | |
|---|---|---|---|
| 0 | 1953-54 | Charles Kraak | Collinsville, IL |
| 1 | 1953-54 | Phil Byers | Evansville, IN |
| 2 | 1953-54 | Neal Skeeters | Louisville, KY |
| 3 | 1953-54 | James Barley | Marion, IN |
| 4 | 1953-54 | Bob Leonard | Terre Haute, IN |
Data Cleaning
As mentioned before, web scraped data can be messy which will require some cleaning and wrangling. Pandas DataFrames are great platforms for cleaning up tabular data. To demonstrate, let’s examine the hometowns where entries do not contain the uppercase State abbreviations. Below, you can see the counts for which this is the case.
iubb.loc[~iubb.Hometown.str.contains(r'[A-Z]{2}')].Hometown.value_counts()
Plymouth, Minn.            6
Cincinnati, Ohio           6
Zionsville, Ind.           5
Munich, Germany            4
Lafayette, Ind.            4
Greenwood, Ind.            4
Newark, N.J.               3
Istmina, Colombia          3
Bloomington, Ind.          3
Culver, Ind.               3
Kansas City, Kan.          2
Houston, Texas             2
San Diego, Calif.          2
Woodbridge, Va.            2
Union City, Tenn.          2
Evansville, Ind.           2
Danville, Calif.           2
Juba, South Sudan          2
Banjul, The Gambia         2
Melbourne, Australia       2
Muiderberg, Netherlands    1
Atlanta, Ga.               1
Tumu, Ghana                1
Pittsburgh, Pa.            1
Miami, Fla.                1
Hampton, Ga.               1
Indianapolis, Ind.         1
Name: Hometown, dtype: int64
We want to analyze the home States and have them show as the State abbreviations. First, we split the Hometown strings by the comma and extract the last entry, which will correspond to the home State. We do recognize that there are players that have come to IU from abroad, but for now, we will consider these to be out of scope. But, at least we have the data available for future use-cases.
iubb["Home State"] = iubb.Hometown.apply(lambda x: x.split(r' ')[-1])
iubb.head()
| Roster Year | Name | Hometown | Home State | |
|---|---|---|---|---|
| 0 | 1953-54 | Charles Kraak | Collinsville, IL | IL |
| 1 | 1953-54 | Phil Byers | Evansville, IN | IN |
| 2 | 1953-54 | Neal Skeeters | Louisville, KY | KY |
| 3 | 1953-54 | James Barley | Marion, IN | IN |
| 4 | 1953-54 | Bob Leonard | Terre Haute, IN | IN |
In order to handle those cases we observed above where the States we shortened instead of abbreviated, we can use the replace function in pandas to handle them. We create a dictionary that informs the function how to replace them. We then call the replace function to perform this clean-up as we instruct. Then, we add columns for Year and Residency for utility and future use-cases.
st_abbr = {"Minn.": "MN",
          "Ohio": "OH",
          "Ind.": "IN",
          "N.J.": "NJ",
          "Kan.": "KS",
          "Texas": "TX",
          "Calif.": "CA",
          "Va.": "VA",
          "Ga.": "GA",
          "Pa.": "PA",
          "Fla.": "FL",
          "Tenn.": "TN",
          "Ill.": "IL"}
iubb["Home State"] = iubb["Home State"].replace(st_abbr, regex=True)
iubb.insert(1, "Year", iubb["Roster Year"].str[0:4].astype(int)+1)
iubb["Residency"] = iubb["Home State"].apply(lambda x: "In-State" if x == "IN" else "Out-of-State")
Now, we can print out the results to see how our DataFrame turned out.
iubb.head()
| Roster Year | Year | Name | Hometown | Home State | Residency | |
|---|---|---|---|---|---|---|
| 0 | 1953-54 | 1954 | Charles Kraak | Collinsville, IL | IL | Out-of-State |
| 1 | 1953-54 | 1954 | Phil Byers | Evansville, IN | IN | In-State |
| 2 | 1953-54 | 1954 | Neal Skeeters | Louisville, KY | KY | Out-of-State |
| 3 | 1953-54 | 1954 | James Barley | Marion, IN | IN | In-State |
| 4 | 1953-54 | 1954 | Bob Leonard | Terre Haute, IN | IN | In-State |
Calculate Roster Compositions
Now that our data is clean enough, we need to calculate the home State composition for each roster year. Stated another way, we want to know for each year, what percent of the roster came from each State. To do this, we can use the groupby function that pandas provides to group by the Year and the State to count the player from each state. Then, we can divide those counts by the total players on the roster for each year. Conveniently, pandas intelligently performs division by matching on Year because the indexes will match. For more information on that, check out the pandas documentation.
iubb_states = (iubb.groupby(["Year", "Home State"])[["Name"]].agg("count") /
 iubb.groupby(["Year"])[["Name"]].agg("count") * 100).round(2).reset_index().rename(columns = {"Name": "Pct"})
iubb_states.head()
| Year | Home State | Pct | |
|---|---|---|---|
| 0 | 1954 | IL | 15.00 |
| 1 | 1954 | IN | 75.00 |
| 2 | 1954 | KY | 5.00 |
| 3 | 1954 | NJ | 5.00 |
| 4 | 1955 | IN | 88.89 |
Data Visualization
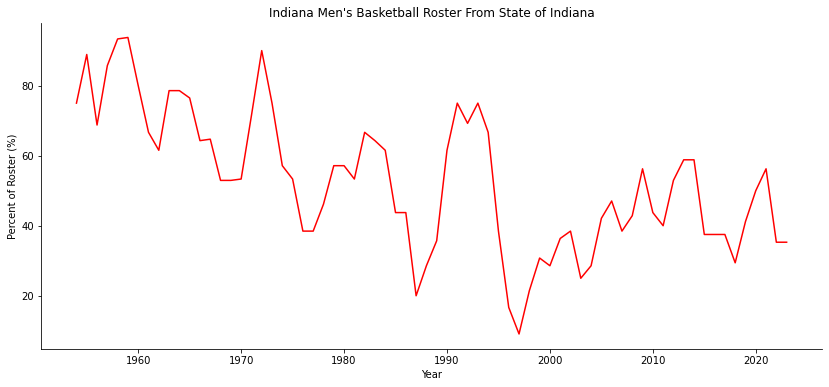
Finally, let’s visualize the percent of the rosters that are from the State of Indiana over time. We will use seaborn’s line plot to create this simple visualization. Since seaborn is built on top of matplotlib, we use matplotlib to alter the look and feel of our visualization as well with some relabeling. After that, we can save off our DataFrame as well.
fig, ax = plt.subplots(figsize = (14,6))
sns.lineplot(data = iubb_states.loc[iubb_states["Home State"] == "IN"], x = "Year", y = "Pct", color = "red")
plt.ylabel("Percent of Roster (%)")
plt.title("Indiana Men's Basketball Roster From State of Indiana")
sns.despine()
iubb.to_csv("iubb_rosters.csv", index = False)
And that concludes this web scraping example! Thank you for following along and I hope you found this a helpful introduction to web scraping.